JournalResearchNo. 04
How to Measure Signal-Based Outbound: A Campaign Scorecard
Measure account selection, positive replies, qualified meetings held and total cost with clear denominators. Includes a free account-level CSV worksheet.
Matija Nikolić8 min read9 sections
Contents
Published by Perpetual
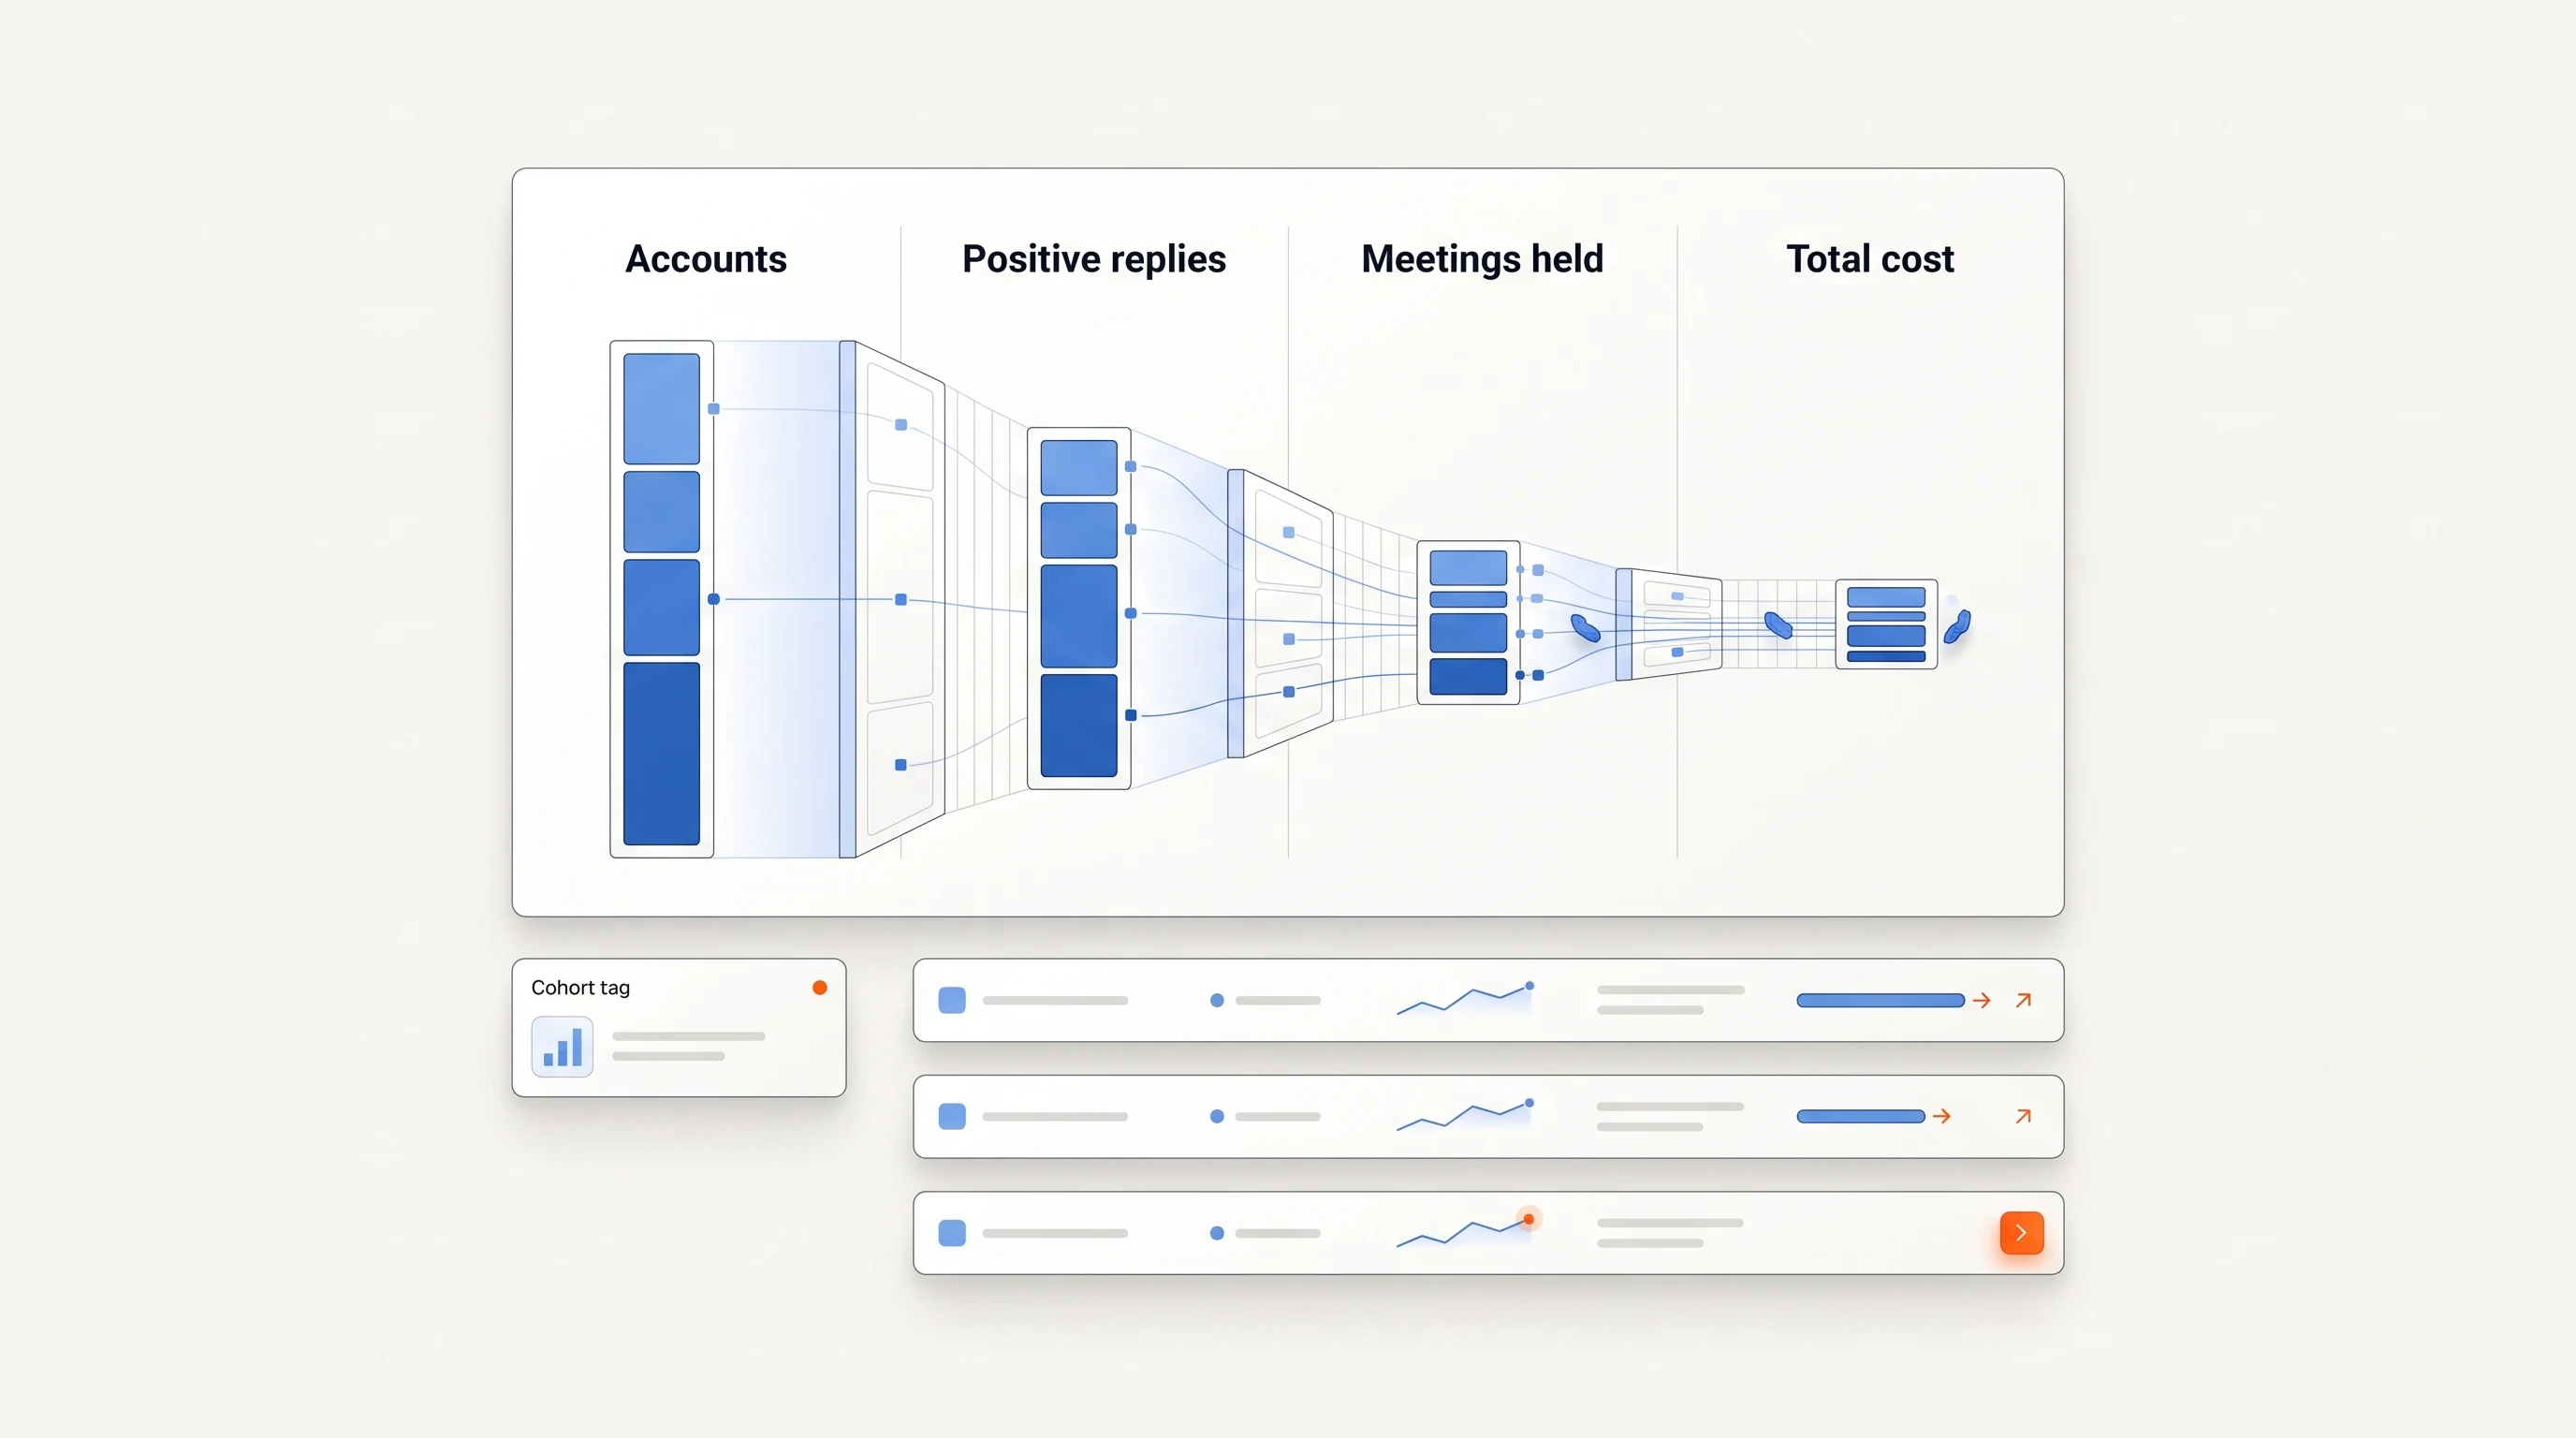
Measure signal-based outbound from the companies you considered through the qualified meetings that actually happened. Keep the cost and the reasons accounts stopped along the way. A reply rate calculated only from a successful slice of the list can hide poor selection, expensive research or a campaign that never reached most of its accounts.
The worksheet in this guide is an account-level research and outcome log. It is useful for a small pilot and for comparing signal types once cohorts have had enough time to develop. The numbers below are fictional arithmetic examples, not Perpetual results or industry benchmarks.
Define the unit and cohort
Choose one row per company for your main campaign scorecard. Use a separate contact or message log if you need to inspect individual recipients and follow-ups. Otherwise, sending four messages to one company can make your activity look like four opportunities.
Freeze the eligible account list and record the selection rule before the test starts. A cohort might be “B2B software companies with an active regional AE role mentioning a new territory, reviewed during the same week.” Keep a version label if you later change the criteria, source, offer or message.
Pick an observation window before evaluating results. For example, compare each cohort 28 days after first contact. That is an example of a consistent window, not a recommended sales-cycle length. If your sales cycle needs longer, choose longer. Record the evaluation date so “no meeting yet” does not silently become “will never convert.”
Keep the whole account funnel
The funnel begins before a contact is found. A signal may be real while the company is unsuitable, the responsible person is unknown or the source is no longer current.
| Account state | What the record should explain |
|---|---|
| Considered | Why the account entered the frozen sample and which source led to it. |
| Qualified | Which account criteria passed and which facts remain unknown. |
| Contactable | Whether a relevant person and usable contact route were verified. |
| Contacted | The first outreach date and campaign version. |
| Delivered | Whether at least one outreach message was recorded as delivered. |
| Positive reply | A response indicating relevant interest or a constructive commercial next step. |
| Meeting booked | A scheduled meeting, still separate from attendance. |
| Qualified meeting held | A completed meeting that met your written qualification rule. |
| Opportunity created | A recorded opportunity that satisfies your sales team's entry criteria. |
Record exclusions and holds with a reason. Wrong industry, stale evidence, unclear ownership and a temporary contact lookup failure need different fixes. A provider failure is a coverage or execution issue; it is not evidence that the company was a poor prospect.
Use metrics with explicit denominators
Write the numerator, denominator and time window beside every rate. The following metrics use distinct companies unless explicitly labeled otherwise.
- Qualification yield: qualified accounts divided by all accounts considered.
- Reach coverage: contacted accounts divided by qualified accounts.
- Positive-reply rate: accounts with a positive reply divided by accounts with at least one delivered message.
- Held-meeting yield: accounts with a qualified meeting held divided by all accounts considered.
- Contacted-to-held rate: accounts with a qualified meeting held divided by contacted accounts.
- Cost per qualified meeting held: total cohort cost divided by the number of qualified meetings held. If there are no held meetings, report it as undefined alongside cost and the zero outcome count.
Define “positive” before labeling replies. An automated response, unsubscribe or a polite refusal is not a positive reply. Keep ambiguous responses in a separate review bucket rather than allowing the label to drift between campaigns.
For cost, include research, contact lookup and verification, sending infrastructure and allocated operator time. State the hourly rate used for time and how you allocated shared subscriptions. Publish cash spend separately if that is useful; do not call it fully loaded cost.
Track account-level opt-outs as well as message-level complaints and bounces. Use their correct denominators in a delivery report. A worksheet with one row per company cannot calculate a reliable per-message bounce rate without a separate message log.
An illustrative scorecard
Suppose a fictional pilot began with 100 considered accounts. After review, 60 qualified and 45 were contacted; 42 accounts had a delivered message. Six accounts replied positively, four meetings were booked, and three qualified meetings were held. Total allocated cost was $450.
| Metric | Calculation | Illustrative result |
|---|---|---|
| Qualification yield | 60 / 100 | 60% |
| Reach coverage | 45 / 60 | 75% |
| Positive-reply rate | 6 / 42 | 14.3% |
| Held-meeting yield | 3 / 100 | 3% |
| Contacted-to-held rate | 3 / 45 | 6.7% |
| Cost per qualified meeting held | $450 / 3 | $150 |
All six statements can be true at once. Choosing only the 14.3% figure hides the accounts that did not qualify or never received outreach. The distinction matters when comparing a convenient signal source with a source that finds fewer but more suitable accounts.
Booked and held meetings are different outcomes. A no-show does not become a held meeting because the calendar invitation was accepted. If one company produces several meetings, the account rate still counts that company once; the cost metric can use the actual number of qualified meetings if you state that definition.
Compare cohorts fairly
Compare the same account segment, offer and outcome definition over equally mature windows. If one campaign has been running for a week and another for two months, separate their early activity and eventual outcomes rather than ranking them together.
For a useful comparison, allocate eligible accounts to versions before outreach and keep other changes limited. If random allocation is impractical, record the differences that could explain the outcome: region, company size, account source, sender, channel and time period. An observed difference is not automatically caused by the signal or email wording.
Small pilots are good at finding obvious failure modes. They are weaker at establishing a stable conversion rate. Show counts beside percentages and avoid declaring a winner because one batch produced two meetings and another produced one.
Also separate independent events from stacked evidence. If the same account has a relevant opening and a new leader, record that combination once for the outreach that used it. Crediting the resulting meeting fully to both signals overstates the total.
Decide what to change
Use the point of loss to choose the next intervention. Low qualification yield suggests a source or account-selection problem. Qualified accounts with no usable person suggest a research or contact-coverage problem. Delivered messages with mostly irrelevant replies suggest the offer, recipient or message angle needs review.
If meetings are booked but not held, inspect scheduling and qualification before increasing sending volume. If research consumes most of the cost, inspect what you investigate before qualification and whether duplicate events are being researched repeatedly.
Review the actual records behind each pattern. One average can combine several unrelated problems. Bring examples of a good outcome, a rejected account and a stalled account to the review.
Download the account worksheet
Download the signal-outbound account worksheet. It contains three fictional records illustrating a held meeting, an account without a positive reply, and an excluded account. Replace all sample rows. The file records inputs and outcomes; it does not contain formulas or automatically compute a dashboard.
Use the ISO date fields for observation and first contact, enter costs in USD consistently, and add operator time before calculating cohort cost. The recorded delivery status means at least one delivered message at that account, not confirmed inbox placement. The meeting field records whether a qualified meeting happened at an account; use a separate meeting log if you count multiple meetings per company.
Choose the source with the signal library, define your play with the hiring guide, and prepare a message with the email templates. Book a demo to discuss a focused pilot with Perpetual.
Where Perpetual fits
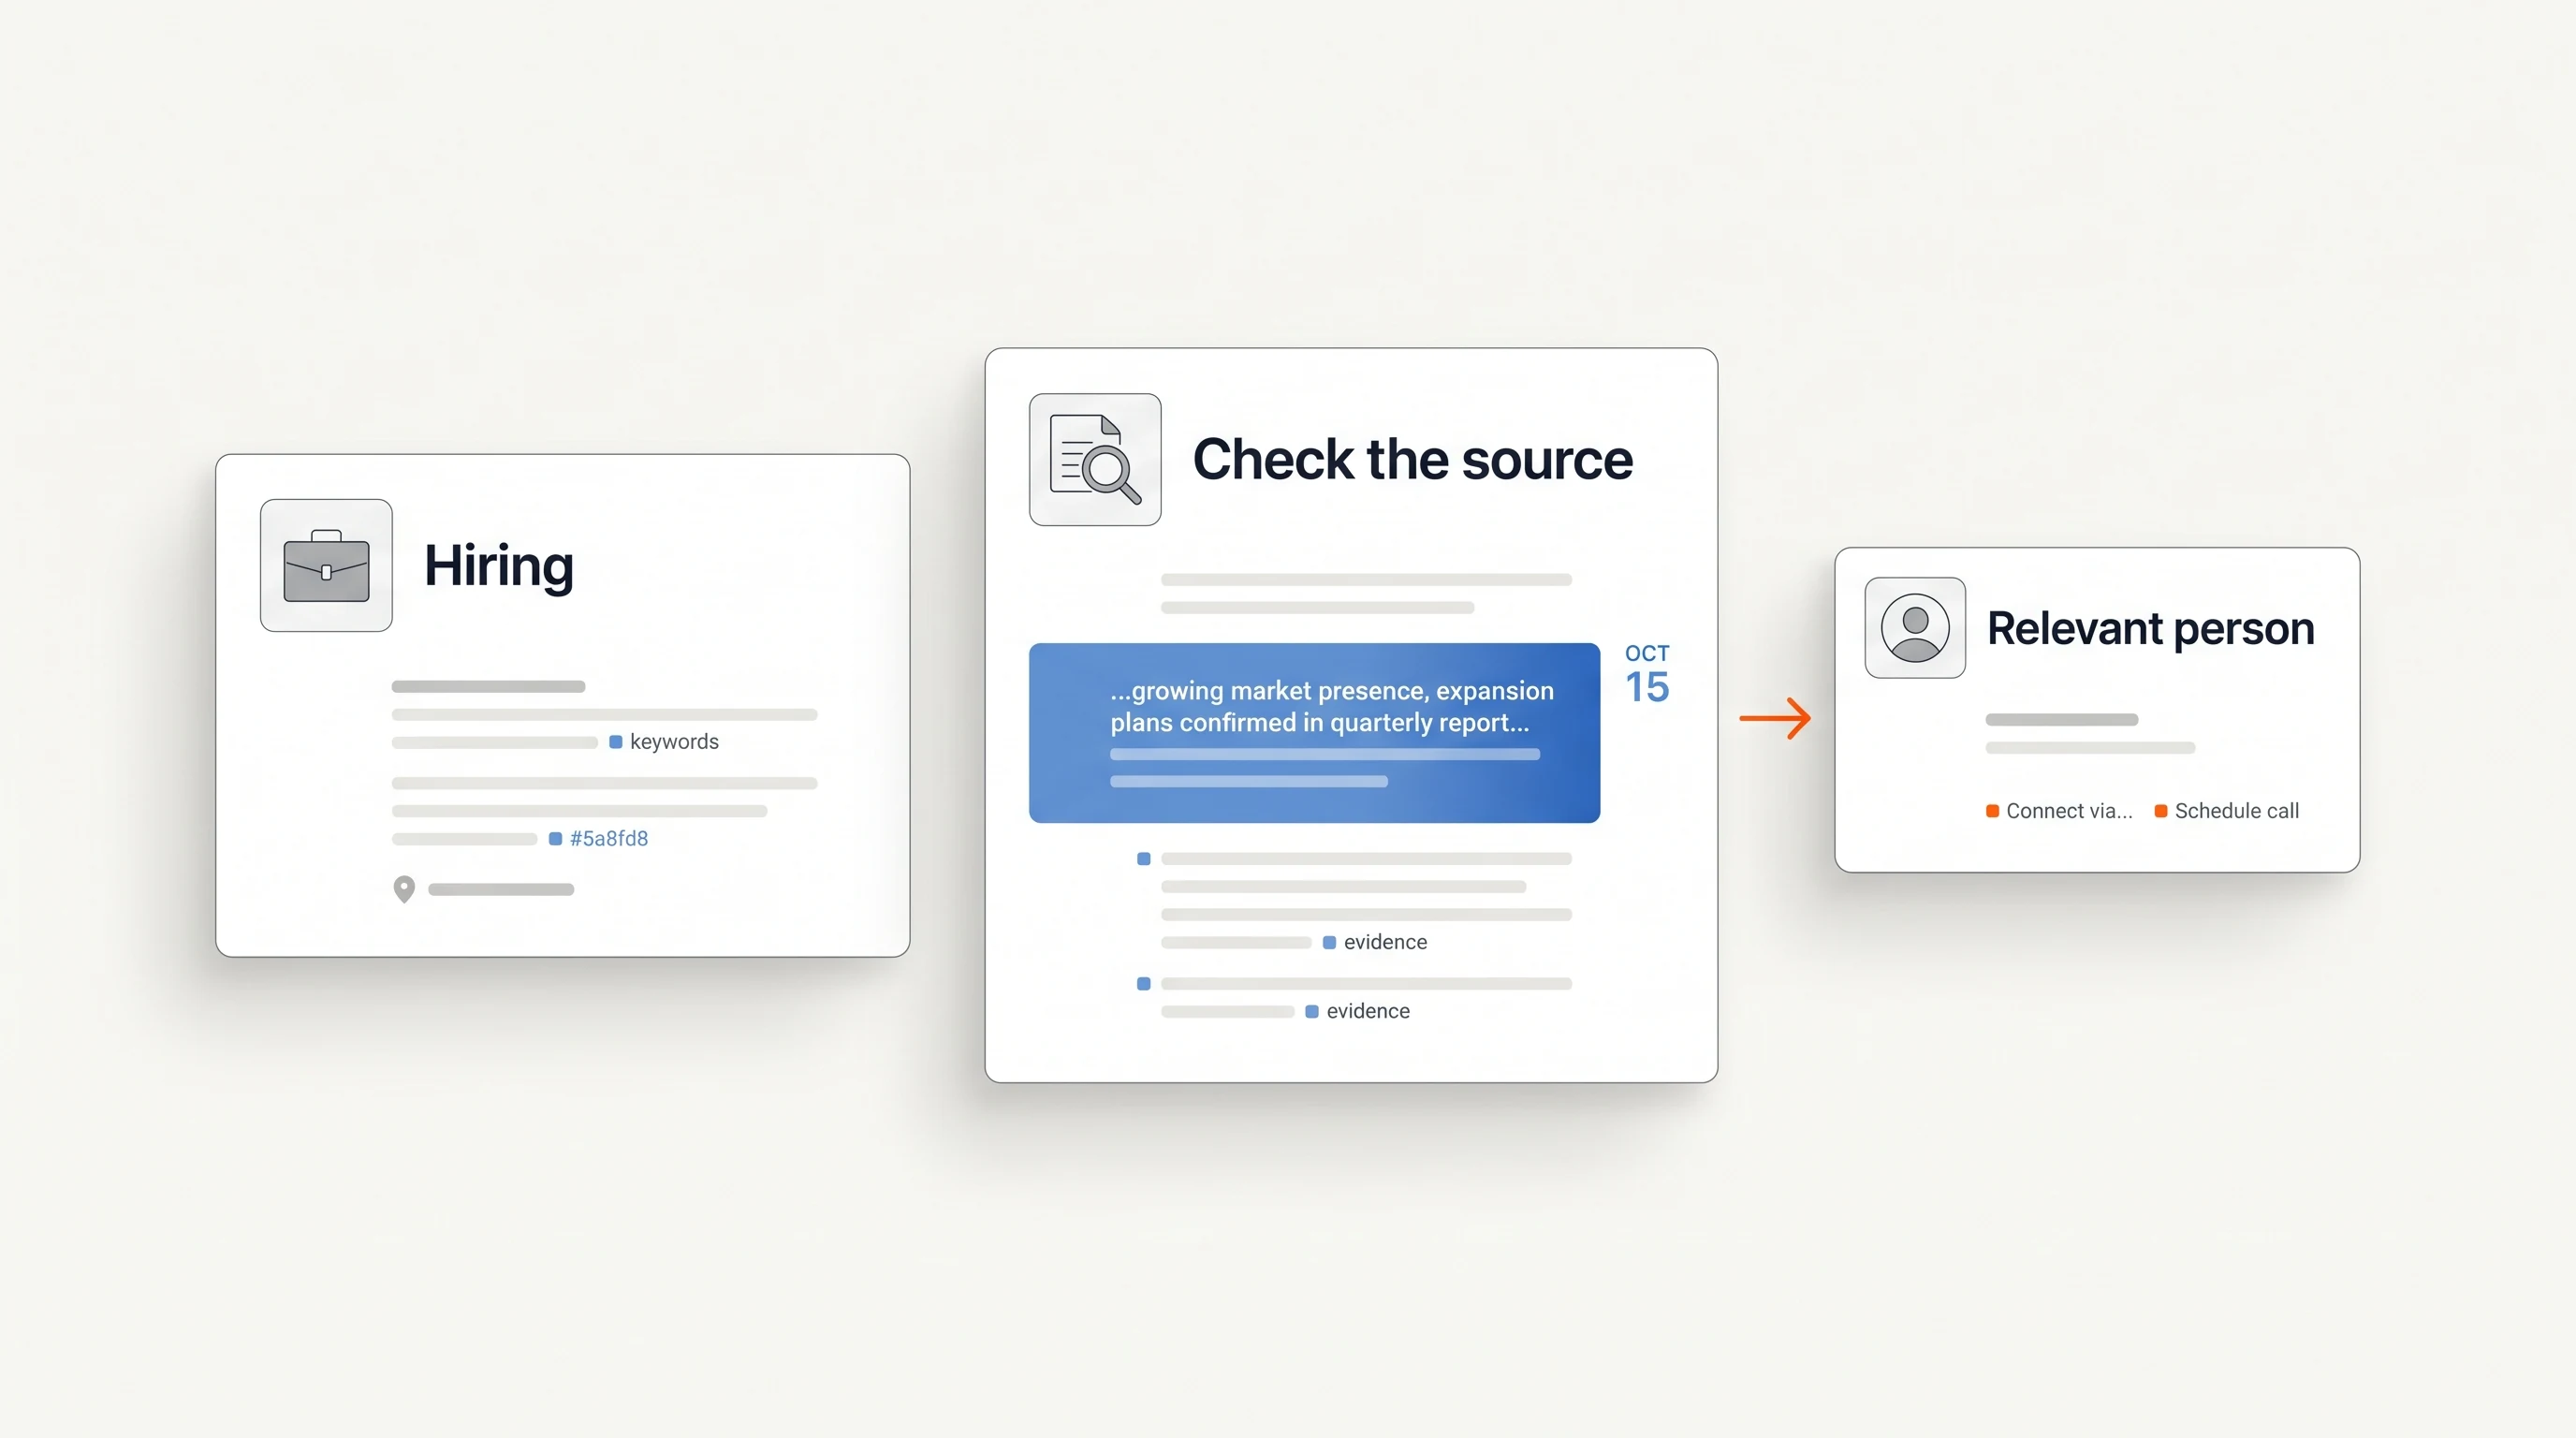
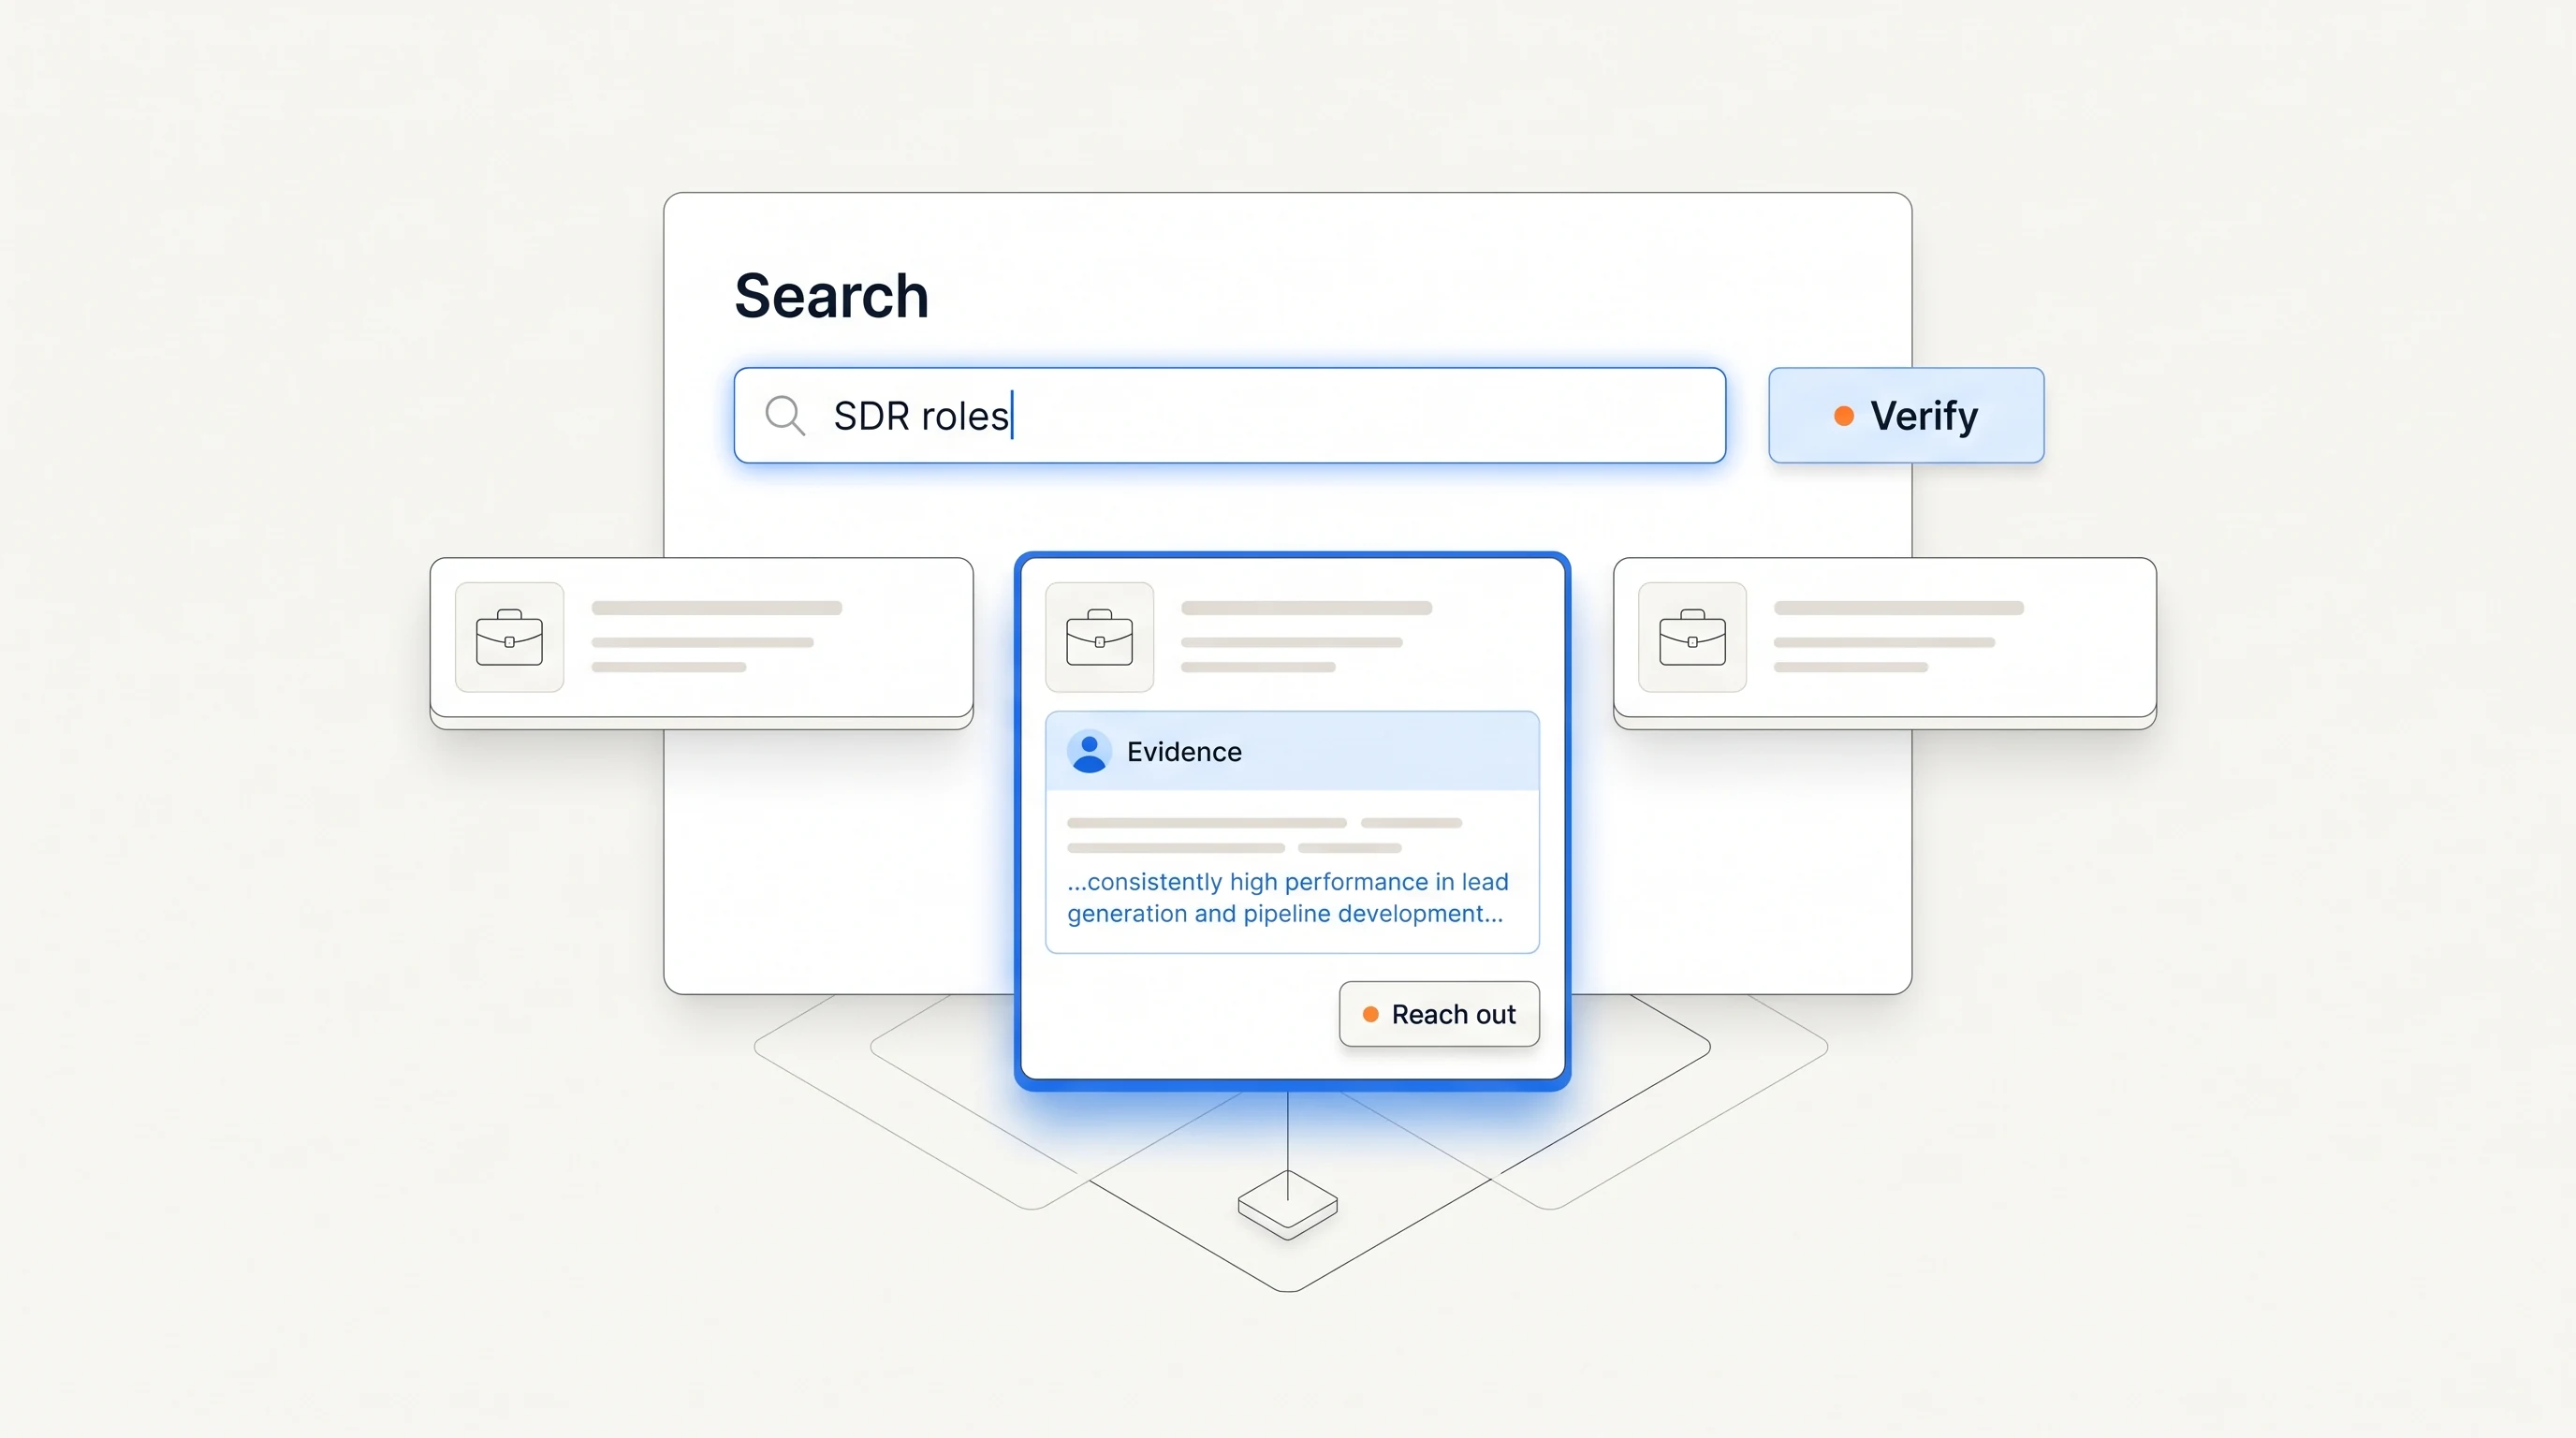
Perpetual is a signal-based outbound tool for founders and B2B sales teams: it turns public hiring activity into qualified companies, selects one relevant person at each and writes a first email grounded in the evidence. Every send is tied to a signal and a selected person, so the account and the reason for contact stay attached to each message, which is the unit this scorecard counts. A signal does not establish purchase intent, so replies and meetings still need the definitions above. Sending stays within limits such as 200 actions per day and 1,000 per week. The quickstart guide shows how a campaign is set up.
Frequently asked questions
Should open rate decide whether a campaign works?
Use downstream outcomes that match the work you want: relevant replies, qualified meetings held and opportunities. Open tracking does not establish that the right person read and understood the message.
What if the campaign produced no meetings?
Report the zero, the cohort's age and the spend. Cost per held meeting is undefined when the denominator is zero. Inspect where accounts stopped before deciding whether to change the source, the offer or execution.
Can I compare two signal types using reply rate alone?
Only as a limited view with the same denominator and time window. Include selection yield, reach, qualified outcomes and cost to see whether one source merely produced a smaller, easier-to-contact group.
Further reading: Unify describes a signal-to-meeting attribution workflow. This guide's definitions, numerical example and downloadable records are an independent planning framework.